Caregiver Statistics: Demographics
Definitions
A caregiver—sometimes called an informal caregiver—is an unpaid individual (for example, a spouse, partner, family member, friend, or neighbor) involved in assisting others with activities of daily living and/or medical tasks. Formal caregivers are paid care providers providing care in one’s home or in a care setting (day care, residential facility, long-term care facility). For the purposes of the present fact sheet, displayed statistics generally refer to caregivers of adults.
The figures below reflect variations in the definitions and criteria used in each cited source. For example, the age of care recipients or relationship of caregiver to care recipient may differ from study to study.
How Many Caregivers in the U.S.?
- Approximately 43.5 million caregivers have provided unpaid care to an adult or child in the last 12 months. [National Alliance for Caregiving and AARP. (2015). Caregiving in the U.S.]
- About 34.2 million Americans have provided unpaid care to an adult age 50 or older in the last 12 months. [National Alliance for Caregiving and AARP. (2015). Caregiving in the U.S.]
- The majority of caregivers (82%) care for one other adult, while 15% care for 2 adults, and 3% for 3 or more adults. [National Alliance for Caregiving and AARP. (2015). Caregiving in the U.S.]
- Approximately 39.8 million caregivers provide care to adults (aged 18+) with a disability or illness or 16.6% of Americans. [Coughlin, J. (2010). Estimating the Impact of Caregiving and Employment on Well-Being: Outcomes & Insights in Health Management.]
- About 15.7 million adult family caregivers care for someone who has Alzheimer’s disease or other dementia. [Alzheimer’s Association. (2015). 2015 Alzheimer’s Disease Facts and Figures.]
Economic Value
- The value of services provided by informal caregivers has steadily increased over the last decade, with an estimated economic value of $470 billion in 2013, up from $450 billion in 2009 and $375 billion in 2007. [AARP Public Policy Institute. (2015). Valuing the Invaluable: 2015 Update.]
- At $470 billion in 2013, the value of unpaid caregiving exceeded the value of paid home care and total Medicaid spending in the same year, and nearly matched the value of the sales of the world’s largest company, Wal-Mart ($477 billion). [AARP Public Policy Institute. (2015). Valuing the Invaluable: 2015 Update.]
- The economic value of the care provided by unpaid caregivers of those with Alzheimer’s disease or other dementias was $217.7 billion in 2014. [Alzheimer’s Association. (2015). 2015 Alzheimer’s Disease Facts and Figures.]
Gender
- 65% of care recipients are female, with an average age of 69.4. The younger the care recipient, the more likely the recipient is to be male. 45% of recipients aged 18-45 are male, while 33% of recipients aged 50 or higher are male. [National Alliance for Caregiving and AARP. (2015). Caregiving in the U.S.]
- Upwards of 75% of all caregivers are female, and may spend as much as 50% more time providing care than males. [Institute on Aging. (2016). Read How IOA Views Aging in America.]
- Male caregivers are less likely to provide personal care, but 24% helped a loved one get dressed compared to 28% of female caregivers. 16% of male caregivers help with bathing versus 30% of females. 40% of male caregivers use paid assistance for a loved one’s personal care. About 14.5 million caregivers are males out of the 43.4% who care for an older family member. [National Alliance for Caregiving and AARP. (2009). Caregiving in the U.S.]
Gender and Care Tasks
- Males may be sharing in caregiving tasks more than in the past, but females still shoulder the major burden of care. For example, while some studies show a relatively equitable distribution of caregiving between males and females, female caregivers spend more time providing care than males do (21.9 vs. 17.4 hours per week). [National Alliance for Caregiving and AARP. (2009). Caregiving in the U.S.]
- Higher-hour caregivers (21 hours or more weekly) are nearly 4 times more likely to be caring for a spouse/partner. [ National Alliance for Caregiving and AARP. (2015). Caregiving in the U.S.]
- Among spousal caregivers aged 75+, both sexes provide equal amounts of care. [McCann, J. J., Hebert, L. E., Beckett, L. A., Morris, M. C., Scherr, P. A., & Evans, D. A. (2000). Comparison of Informal Caregiving by Black and White Older Adults in a Community Population.]
- Other studies indicate that 36% of female caregivers handle the most difficult caregiving tasks (i.e., bathing, toileting, and dressing) when compared with 24% for their male counterparts, who are more likely to help with finances, arrangement of care, and other less burdensome tasks. [National Alliance for Caregiving and AARP. (2009). Caregiving in the U.S.]
Caregiving in the Lesbian, Gay, Bisexual, and Transgender (LGBTQ+) Communities
- 9% of caregivers self-identify as LGBTQ+. [National Alliance for Caregiving and AARP. (2015). Caregiving in the U.S.]
- There are at least 3 million LGBTQ+ persons aged 55+ in the U.S. This number is expected to double in the next two decades. [Espinoza, R. (2014). Out and Visible: The Experiences and Attitudes of Lesbian, Gay, Bisexual and Transgender Older Adults, Ages 45-75.]
- Male caregivers report providing more hours of care than female caregivers. The average weekly hours of care provided by females from both the LGBTQ+ and general population samples is similar—26 vs. 28 hours—but LGBTQ+ males provide far more hours of care than males from the comparison sample (41 hours vs. 29). This reflects that about 14% of gay males indicate that they are full-time caregivers, spending over 150 hours per week in this capacity, compared to 3% of lesbian and 2% of bisexual respondents. [MetLife. (2010). Still Out, Still Aging: Study of Lesbian, Gay, Bisexual, and Transgender Baby Boomers.]
- LGBTQ+ individuals are more likely to be very concerned about having enough money (51% vs. 36%), experiencing loneliness in old age (32% vs. 19%), declining physical health (43% vs. 33%), not being able to take care of themselves (43% vs. 34%) or not having anybody to take care of them (30% vs. 16%) compared to non-LGBT. [Fredriksen-Goldsen, K. I., Kim, H. J., Emlet, C. A., Muraco, A., Erosheva, E. A., Hoy-Ellis, C. P., Goldsen, J., & Petry, H. (2011). The Aging and Health Report: Disparities and Resilience among Lesbian, Gay, Bisexual, and Transgender Older Adults.]
- 20% of older LGBTQ+ individuals and 44% of older transgender individuals feel their relationship with their healthcare provider would be adversely affected if their health provider knew their sexual orientation/gender. [Fredriksen-Goldsen, K. I., Kim, H.-J., Emlet, C. A., Muraco, A., Erosheva, E. A., Hoy-Ellis, C. P., Goldsen, J., & Petry, H. (2011). The Aging and Health Report: Disparities and Resilience among Lesbian, Gay, Bisexual, and Transgender Older Adults.]
- LGBTQ+ older adults are twice as likely to age as a single person, twice as likely to reside alone, and three to four times less likely to have children. [MetLife. (2010). Still Out, Still Aging: The MetLife Study of Lesbian, Gay, Bisexual, and Transgender Baby Boomers.]
Caregiving Tasks
- On average, caregivers spend:
- 13 days each month on tasks such as shopping, food preparation, housekeeping, laundry, transportation, and giving medication;
- 6 days per month on feeding, dressing, grooming, walking, bathing, and assistance toileting;
- 13 hours per month researching care services or information on disease, coordinating physician visits or managing financial matters. [Gallup-Healthways. (2011). Gallup-Healthways Well-Being Index.]
- Of family caregivers who provide complex chronic care:
- 46% perform medical and nursing tasks;
- More than 96% provide help with activities of daily living (ADLs) such as personal hygiene, dressing and undressing, getting in and out of bed, or instrumental activities of daily living (IADLs) such as taking prescribed medications, shopping for groceries, transportation, or using technology, or both. [AARP and United Health Hospital Fund. (2012). Home Alone: Family Caregivers Providing Complex Chronic Care.]
- On average, caregivers perform 1.7 of 6 ADLs, most commonly getting in and out of beds and chairs (43%). [National Alliance for Caregiving and AARP. (2015). Caregiving in the U.S.]
- On average, caregivers perform 4.2 of 7 IADLs, most commonly transportation (78%), grocery or other shopping (76%), and housework (72%). [National Alliance for Caregiving and AARP. (2015). Caregiving in the U.S.]
- 57% of caregivers report that they do not have a choice about performing clinical tasks, and that this lack of choice is self-imposed.
- 43% feel that these tasks are their personal responsibility because no one else can do it or because insurance will not pay for a professional caregiver.
- 12% report that they are pressured to perform these tasks by the care receiver.
- 8% report that they are pressured to perform these tasks by another family member. [AARP and United Health Hospital Fund. (2012). Home Alone: Family Caregivers Providing Complex Chronic Care.]
- Caregivers report holding significant decision-making authority regarding the following:
- Monitoring of the care recipient’s condition and adjusting care (66%);
- Communicating with healthcare professionals on behalf of the care recipient (63%);
- Acting as an advocate for the care recipient with care providers, community services, or government agencies (50%). [National Alliance for Caregiving and AARP. (2015). Caregiving in the U.S.]
Age
- Distribution of caregiver age:
- Average age: 49.2 years old
- 48% of caregivers are 18-49 years old
- 34% of caregivers are 65+ years old [National Alliance for Caregiving and AARP. (2015). Caregiving in the U.S.]
- Distribution of care recipient age:
- Average age: 69.4 years old
- 14% of care recipients are 18-49 years old
- 47% of care recipients are 75+ years old [National Alliance for Caregiving and AARP. (2015). Caregiving in the U.S.]
- The number of hours dedicated to caregiving increases with the age of the caregiver.
- Higher-hour caregivers are, on average, 51.8 years of age.
- Lower-hour caregivers average 48 years of age.
Number of Hours Dedicated to Caregiving by Age of Family Caregiver
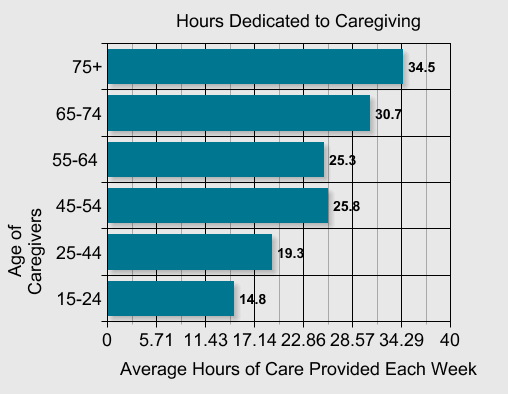
[The Partnership for Solutions. (2004). Chronic Conditions: Making the Case for Ongoing Care.]
- Older caregivers are more likely to care for a spouse or partner. The average age of spousal caregivers is 62.3. [National Alliance for Caregiving and AARP. (2015). Caregiving in the U.S.]
- Many caregivers of older adults are themselves growing older. The average caregiver of a recipient 65 years of age or older is 63 years old. Of these caregivers, one third report being in fair to poor health. [Administration on Aging. (2005). NFCSP: Complete Resource Guide.]
Time Spent Caregiving
- 4 in 10 (40%) caregivers are in high-burden situations, 18% medium burden, and 41% low burden based on the Level of Care Index (1997). Burden of care increases with hours of care provided. 92% of providers providing 21 or more hours per week are high burden versus 16% of lower hour providers. [National Alliance for Caregiving and AARP. (2015). Caregiving in the U.S.]
- Primary family caregivers of people with dementia report spending an average of 9 hours per day providing help to their relatives. [Fisher, G. G., Franks, M. M., Plassman, B. L., Brown, S. L., Potter, G. G., Llewellyn, D., et al. (2011). Caring for Individuals with Dementia and Cognitive Impairment, not Dementia: Findings from the Aging, Demographics, and Memory Study.]
Hours per Week
- Family caregivers spend an average of 24.4 hours per week providing care. Nearly 1 in 4 caregivers spends 41 hours or more per week providing care. [National Alliance for Caregiving and AARP. (2015). Caregiving in the U.S.]
- Family caregivers who reside with those they provide care for spend 40.5 hours per week caring for this person.
- Those caring for a spouse/partner spend 44.6 hours per week performing caregiving tasks.
- Those caring for a child under age 18 spend 29.7 hours per week performing caregiving tasks. [National Alliance for Caregiving and AARP. (2015). Caregiving in the U.S.]
- Older caregivers who are 75+ years old provide 34 hours in an average week on caregiving. Middle aged caregivers report spending 21.7 hours per week on caregiving tasks. [National Alliance for Caregiving and AARP. (2015). Caregiving in the U.S.]
- Family and other unpaid caregivers of people with Alzheimer’s disease and other dementias provide an estimated 21.9 hours of care per week. [Alzheimer’s Association. (2015). 2015 Alzheimer’s Disease Facts and Figures.]
Months and Years Providing Care
- The average duration of a caregiver’s role is 4 years.
- Only 30% of caregivers provide care for less than a year.
- 24% of caregivers provide care for more than 5 years.
- 15% of caregivers provide care for 10 or more years. Higher-hour caregivers are twice as likely to have been in their caregiving role for 10 years or more. [National Alliance for Caregiving and AARP. (2015). Caregiving in the U.S.]
- Regardless of employment status, unpaid caregivers report that positive activities in their respective daily lives are reduced by 27.2% as a result of their caregiving responsibilities. This effect is three times greater in their personal lives than in their professional lives. [Coughlin, J. (2010). Estimating the Impact of Caregiving and Employment on Well-Being: Outcomes & Insights in Health Management.]
- Measured by duration of care, Alzheimer’s and dementia caregivers provide care on average 1-4 years more than caregivers caring for someone with an illness other than Alzheimer’s disease. They are also more likely to be providing care for five years or longer. [Alzheimer’s Association. (2015). 2015 Alzheimer’s Disease Facts and Figures.]
Race and Ethnicity
- Individual adult caregivers in the U.S. identify their race/ethnicity as the following:
- White: 62%
- African-American: 13%
- Hispanic (non-White, non-African-American): 17%
- Asian-American: 6% [National Alliance for Caregiving and AARP. (2015). Caregiving in the U.S.]
- Hispanic (non-White, non-African-American) caregivers have the highest reported prevalence of caregiving at 21%. Caregiver prevalence among other racial/ethnic groups are as follows:
- African-American: 20.3%
- Asian-American: 19.7%
- White: 16.9% [National Alliance for Caregiving and AARP. (2015). Caregiving in the U.S.]
- White caregivers are on average older (52.5 years old) than their counterparts among other races/ethnicities. The average age of caregivers among other racial/ethnic groups are as follows:
- Asian-American: 46.6 years old
- African-American: 44.2 years old
- Hispanic (non-White, non-African-American): 42.7 years old [National Alliance for Caregiving and AARP. (2015). Caregiving in the U.S.]
- Hispanic (non-White, non-African-American) and African-American caregivers experience higher burdens from caregiving and spend more time caregiving on average than their White or Asian-American peers. The percentage of high burden caregivers caregiving time by racial/ethnic groups are as follows:
- African-American: 57%, 30 hours per week
- Hispanic (non-White, non-African-American): 45%, 30 hours per week
- White: 33%, 20 hours per week
- Asian-American: 30%, 16 hours per week [Alzheimer’s Association. (2015). 2015 Alzheimer’s Disease Facts and Figures.]
- More than half of African-American caregivers find themselves “sandwiched” between caring for an older person and a younger person under age 18, or caring for more than one older person. African-American caregivers are also more likely to reside with the care recipient and spend an average of 20.6 hours per week providing care. In addition, 66 percent of African-American caregivers are employed full or part-time. [National Alliance for Caregiving and AARP. (2015). Caregiving in the U.S.]
- The needs of care recipients vary by race/ethnicity. African-American caregivers (41%) are more likely to provide help with more than three ADLs than white caregivers (28%) or Asian-Americans (23%). [Alzheimer’s Association. (2015). 2015 Alzheimer’s Disease Facts and Figures.]
Relationships between Caregivers and Care Recipients
- A vast majority of caregivers (85%) care for a relative or other loved one:
- 42% care for a parent (31% for a mother, 11% for a father);
- 15% care for a friend, neighbor or another non-relative;
- 14 % care for a child;
- 7% care for a parent-in-law;
- 7% care for a grandparent or grandparent-in-law. [National Alliance for Caregiving and AARP. (2015). Caregiving in the U.S.]
- Parent care continues to be the primary caregiving situation for mid-life caregivers with 70% of the caregivers between the ages of 50 and 64. [Wagner, D. & Takagi, E. (2010). Health Affairs: Informal Caregiving by and for Older Adults.]
- Most care recipients reside in their own home (48%), and one in three (35%) reside in their caregiver’s home. 3 in 10 care recipients who are not in assisted-living or skilled nursing facilities reside alone (31%).
[National Alliance for Caregiving and AARP. (2009 & 2015). Caregiving in the U.S.]
Elder Abuse
- The Department of Health defines abuse as, “a violation of an individual’s human and civil rights by another person or persons.” Abuse can take many forms, including physical, psychological, sexual, or financial abuse, discrimination, or neglect.
- Under this definition, as many as 25% of elder care recipients report significant levels of abuse. [Cooper, C., Selwood, A., & Livingston, G. (2008). The Prevalence of Elder Abuse and Neglect: A Systematic Review.]
- Approximately 1 in 10 Americans aged 60+ have experienced some form of elder abuse. Some estimates range as high as 5 million elders who are abused each year. [National Council on Aging. (2016). Elder Abuse Facts.]
- Only 7% of elder abuse cases are ever reported to authorities. [National Research Council. (2003). Elder Mistreatment: Abuse, Neglect and Exploitation in an Aging America.]
- For every 1 case of elder abuse known to programs and agencies there are 24 unknown cases. [Lifespan of Greater Rochester, Inc., Weill Cornell Medical Center of Cornell University & New York City Department for the Aging. (2011). Under the Radar: New York State Elder Abuse Prevalence Study.]
- Elder abuse, even modest abuse, increases risk of death by 300% compared to elders who have not been abused. [Dong, X., Simon, M. A., Beck, T., Farran, C., McCann, J., Mendes de Leon, C., et al. (2011). Elder Abuse and Mortality: The Role of Psychological and Social Wellbeing.]
- The direct medical costs associated with violent injuries to older adults are estimated to add over $5.3 billion to the nation’s annual health expenditures, and the annual financial loss by victims of elder financial exploitation were estimated to be $2.9 billion in 2009, a 12% increase from 2008. [Administration on Aging: National Center on Elder Abuse. (2016). Statistics/Data: Impact of Elder Abuse].
Geographic Distance Between Caregiver and Care Recipient
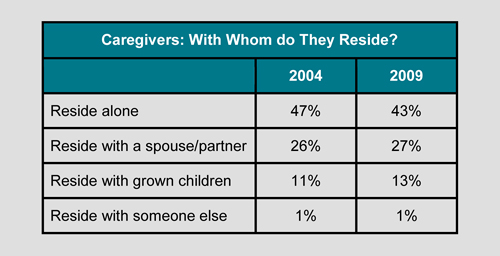
- The vast majority of caregivers (75%) reside within 20 minutes of their care recipient. 13% of caregivers reside between 20 minutes and an hour away from their care recipient.
- The proportion of caregivers reporting they reside fewer than 20 minutes from the home of their care recipient has increased steadily over the past 10 years (44% in 2004, 51% in 2009, and 75% in 2015). [National Alliance for Caregiving and AARP. (2015). Caregiving in the U.S.]
- As the age of the caregiver increases, their distance from their recipient decreases. 84% of caregivers aged 75+ reside within 20 minutes of their care recipient, compared to their caregiving peers in other age brackets:
- 76% of caregivers aged 65-74
- 72% of caregivers aged 50-64
- 74% of caregivers aged 18-49 [National Alliance for Caregiving and AARP. (2015). Caregiving in the U.S.]
- 48% of care recipients reside in their own home.
- Higher-hour care recipients are less likely to reside at home (28%) than lower-hour recipients (57%).
- Inversely, higher-hour care recipients are more likely to reside in their caregiver’s home (62%) than lower-hour recipients (22%). [National Alliance for Caregiving and AARP. (2015). Caregiving in the U.S.]
- Approximately 5-7 million caregivers in the U.S. (about 15% of all caregivers) are long-distance caregivers. This number is projected to double by 2020. [National Council on Aging. (2006). Nearly 7 Million Long-Distance Caregivers Make Work and Personal Sacrifices.]
- Long-distance caregivers have the highest annual expenses (about $8,728) compared to co-resident caregivers (about $5,885) or those who care for a loved one nearby (about $4,570). [AARP Public Policy Institute. (2008). Valuing the Invaluable: The Economic Value of Family Caregiving.]
- Long-distance caregivers reside an average of 450 miles (724 km) from their care recipients (or approximately 7 hours travel time).
- More males (58%) than females (42%) are long-distance caregivers. [National Alliance for Caregiving and the MetLife Mature Market Institute. (2004). Miles Away: The MetLife Study of Long-Distance Caregiving.]
- Long-distance caregivers are more likely to report emotional distress (47%) than caregivers either residing with their care recipient (43%) or residing less than one hour away (28%). [National Alliance for Caregiving and AARP. (2004). Caregiving in the U.S.]
- Caregivers who do not reside with their care receiver reside the following distances from those for whom they care:
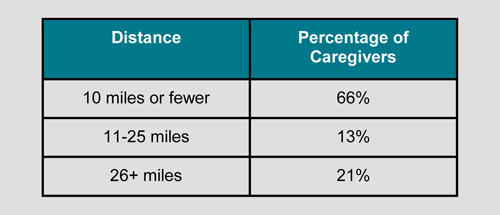
[Gallup-Healthways. (2011). Gallup-Healthways Well-Being Survey: Caregiving Costs U.S. Economy $25.2 Billion in Lost Productivity.]
Caregiving in Rural Areas
- More than half of the 65 million Americans living in rural areas are over the age of 50. Elders in rural areas (about a quarter of all elders) are more likely to reside alone, near or at the poverty level, and suffer from a chronic condition or physical disability. They require an average of 46 miles of travel to get to the nearest health professional. [U.S. Department of Health and Human Services Rural Task Force. (2002). HHS Rural Task Force Report.]
- 3-6 million Americans are distance caregivers who provide care for a family member that resides an average of 450 miles away. [National Alliance for Caregiving & AARP. (2005). Caregiving in the U.S.]
- About 51% of caregivers in rural areas use community-based services. [Buckwalter, K. C., & Davis, L. L. (2009). Elder Caregiving in Rural Communities.]
Older Adults with Developmental Disabilities
- There are an estimated 641,000 adults aged 60+ with cognitive and other disabilities (e.g., cerebral palsy, autism, epilepsy, traumatic brain injury).
- This number is projected to double to 1,242,794 by 2030, coinciding with the aging population of baby boomers born between 1946 and 1964. [Heller, T. (2011). Strength for Caring: Older Adults with Developmental Disabilities and Their Aging Family Caregivers.]
- Families are still the primary caregivers for adults with developmental disabilities and are themselves aging. About 76% of individuals with developmental disabilities reside at home.
- In 25% of these homes, the family caregiver is over 60 years of age.
- The average age of the care recipient with a developmental disability is age 38. [Heller, T. (2011). Strength for Caring: Older Adults with Developmental Disabilities and Their Aging Family Caregivers.]
Veterans
- There are a total of 5.5 million caregivers caring for former or current military personnel in the U.S. (1.1 million post 9/11). [Ramchand, R., Tanielian, T., Fisher, M., Vaughan, C., Trail, T., Batka, C., Voorhies, P., Robbins, M., Robinson, E., & Ghosh-Dastidar, B. (2014). Key Facts and Statistics from the RAND Military Caregivers Study.]
- 9 in 10 (96%) caregivers of veterans are female and 70% provide care to their spouse or partner. 30% of veterans’ caregivers care for a duration of 10 years or more as compared to 15% of caregivers nationally. 88% report increased stress or anxiety as a result of caregiving, and 77% state sleep deprivation as an issue. [National Alliance for Caregiving and United Health Foundation. (2010). Caregivers of Veterans: Serving on the Home Front.]
- Military caregivers after 9/11 are more likely to be employed (63% vs. 47%), less likely to have a support network (47% vs. 71%), younger (37% under 30 years old vs. 11%), more likely to be caring for a recipient with a behavioral health condition (64% vs. 36%) or a VA disability rating (58% vs. 30%). [Ramchand, R., Tanielian, T., Fisher, M., Vaughan, C., Trail, T., Batka, C., Voorhies, P., Robbins, M., Robinson, E., & Ghosh-Dastidar, B. (2014). Key Facts and Statistics from the RAND Military Caregivers Study.]
- Veteran care recipients (post 9/11) are more likely to have no health insurance (32% vs. 23%) or regular source of health care (28% vs. 14%), have a mobility limiting disability (80% vs. 66%) or mental health/substance abuse condition (64% vs. 33%), and meet criteria for probable depression (38% vs. 20%) compared to civilians. [Ramchand, R., Tanielian, T., Fisher, M., Vaughan, C., Trail, T., Batka, C., Voorhies, P., Robbins, M., Robinson, E., & Ghosh-Dastidar, B. (2014). Key Facts and Statistics from the RAND Military Caregivers Study.]
- Veterans suffer more frequently from Traumatic Brain Injury (29%), Post-traumatic Stress Disorder, Diabetes (28%), and paralysis or Spinal Cord Injury (20%). [National Alliance for Caregiving and United Health Foundation. (2010). Caregivers of Veterans: Serving on the Home Front.]
Family Caregiver Alliance
National Center on Caregiving
(415) 434-3388 | (800) 445-8106
Website: www.caregiver.org
Email: info@caregiver.org
FCA CareNav: https://fca.cacrc.org/login
Services by State: www.caregiver.org/connecting-caregivers/services-by-state/.
Family Caregiver Alliance (FCA) seeks to improve the quality of life for caregivers through education, services, research, and advocacy. Through its National Center on Caregiving, FCA offers information on current social, public policy, and caregiving issues and provides assistance in the development of public and private programs for caregivers. For residents of the greater San Francisco Bay Area, FCA provides direct support services for caregivers of those with Alzheimerʼs disease, stroke, traumatic brain injury, Parkinsonʼs, and other debilitating disorders that strike adults.
The present fact sheet was prepared by Family Caregiver Alliance. © 2016 Family Caregiver Alliance. All rights reserved.